Overview
Examiner nodes in an Automated Ingest environment can be given a type of administrator access. This allows an admin to:
-
Access admin-only options on the Auto Ingest Jobs Panel, including:
- Prioritizing jobs and cases
- Cancelling jobs
- Deleting and reprocessing jobs
-
Access the Auto Ingest Nodes Panel, which allows the user to:
- View the currently active auto ingest nodes
- Pause/resume/shutdown the active auto ingest nodes
- View/enabled the health monitor
- View auto ingest metrics
Setup
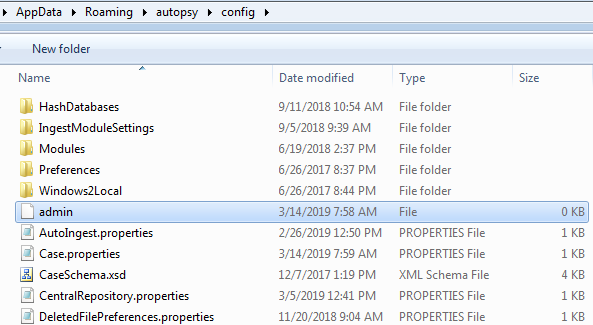
The admin panel is enabled by creating the file "admin" in the user config directory. Note that the name must be exactly that with no extension. It also works to make a folder named "admin" instead of a file which can be easier on machines where the file extension is hidden. No restart is needed; simply reopen the Auto Ingest Dashboard after creating the file.
For an installed copy of Autopsy, the file will go under "C:\Users\<user name>\AppData\Roaming\Autopsy\config".
Auto Ingest Jobs Panel
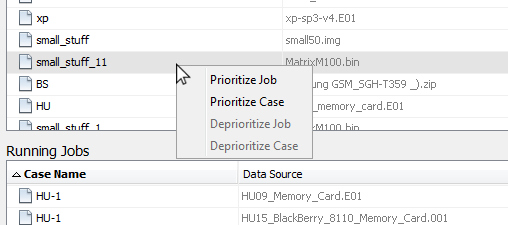
With the admin file in place, the user can right-click on jobs in each of the tables of the jobs panel to perform different actions. In the Pending Jobs table, the context menu allows cases and individual jobs to be prioritized.
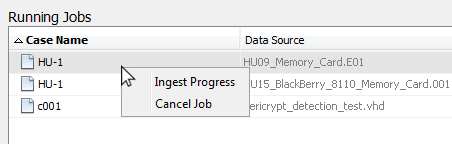
In the Running Jobs tables, the ingest progress can be viewed and the current job can be cancelled. Note that cancellation can take some time.
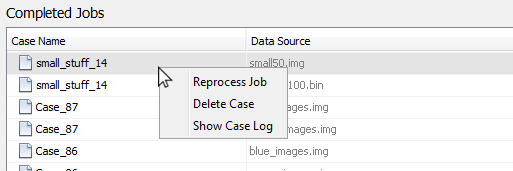
In the Completed Jobs table, the user can reprocess a job (generally useful when a job had errors), delete a case (if no other machines are using it) and view the case log.
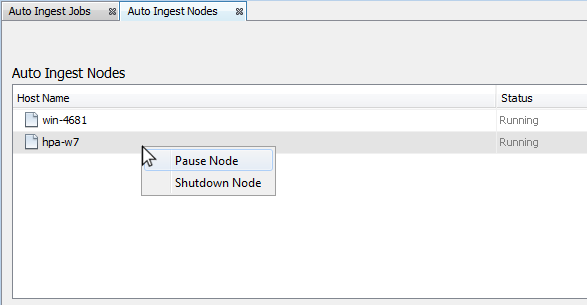
Auto Ingest Nodes Panel
The Nodes panel displays the status of every online auto ingest node. Additionally, an admin can pause or resume a node, or shut down a node entirely (i.e., exit the Autopsy app).
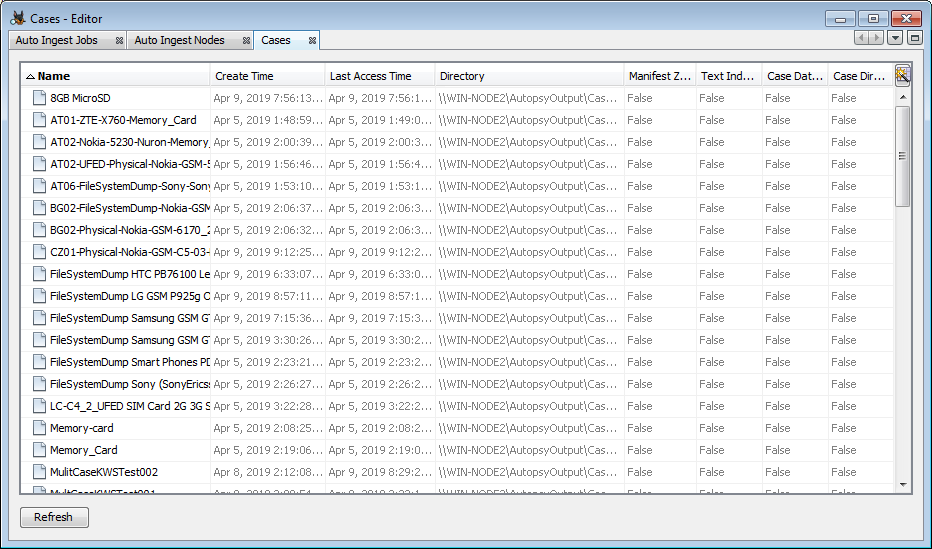
Cases Panel
The Cases panel shows information about each auto ingest case - the name, creation and last accessed times, the case directory, and flags for which parts of the case have been deleted.
If you right-click on a case, you can open it, see the log, delete the case, or view properties of the case.
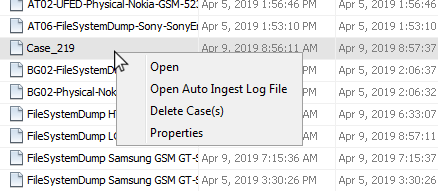
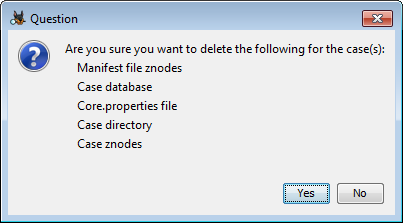
Note that you can select multiple cases at once to delete. If you choose to delete a case (or cases), you'll see the following confirmation dialog:
Health Monitor
The health monitor shows timing stats and the general state of the system. The Health Monitor is accessed from the Auto Ingest Nodes panel. To enable health monitoring, click on the Health Monitor button to get the following screen and then press the "Enable monitor" button.
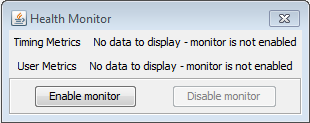
This will enable the health monitor metrics on every node (both auto ingest nodes and examiner nodes) that is using this PostgreSQL server. Once enabled, the monitor will display the collected metrics.
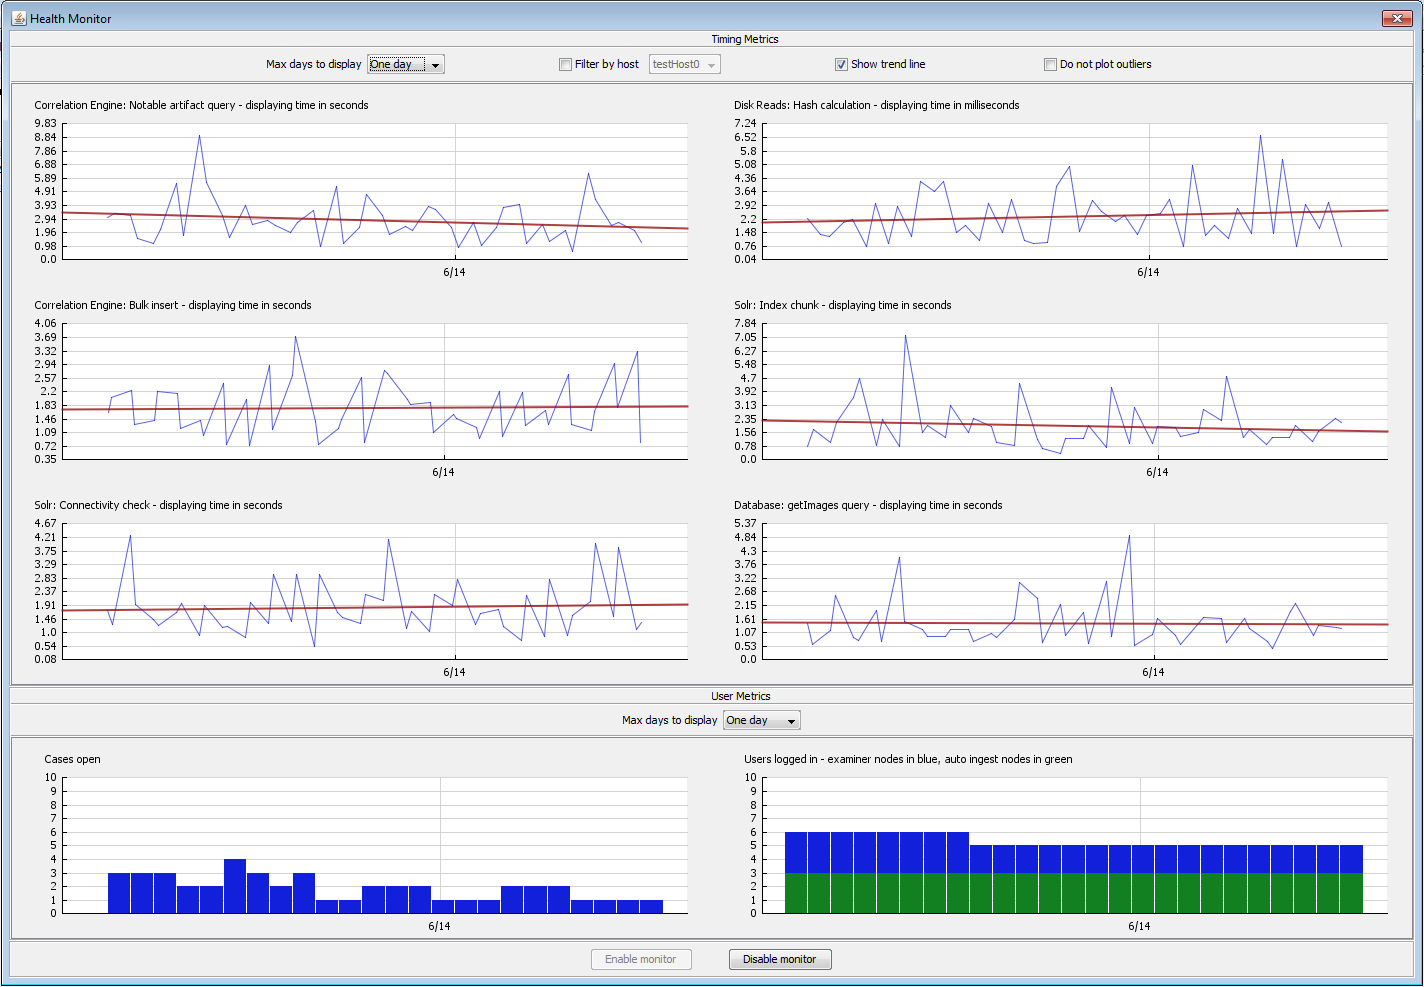
By default, the graphs will show all metrics collected in the last day.
The Timing Metrics area shows how long various tasks took to perform. There are several options in the Timing Metrics section:
- Max days to display: Choose to show the last day, week, two week, or month
- Filter by host: Show only metrics that came from the selected host
- Show trend line: Show or hide the red trend line
- Do not plot outliers: Redraws the graph allowing very high metrics to go off the screen. Can be helpful with data where a couple of entries took an exceptionally long time.
The User Metrics section shows open cases and logged on nodes. For the open cases section, the count is the number of distinct cases open. If ten nodes have the same case open, the count will be one. The logged in users section shows the total number of active nodes, with auto ingest nodes on the bottom in green and examiner nodes on top in blue. The User Metrics section only has one option:
- Max days to display: Choose to show the last day, week, two week, or month
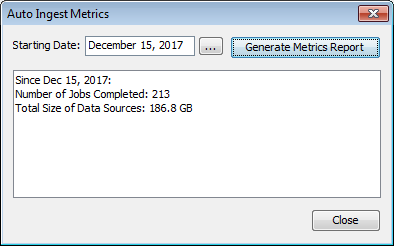
Auto Ingest Metrics
The Auto Ingest Metrics can be accessed the Auto Ingest Nodes panel and shows data about the jobs completed in a selected time frame.