Table of Contents
Overview
The Communications Visualization Tool gives a consolidated view of all communication events for the case. This allows an analyst to quickly view communications data such as:
- The most commonly used accounts
- Communications within a specific time frame
Usage
The Communications Visualization Tool is loaded through the Tools->Communications menu item.
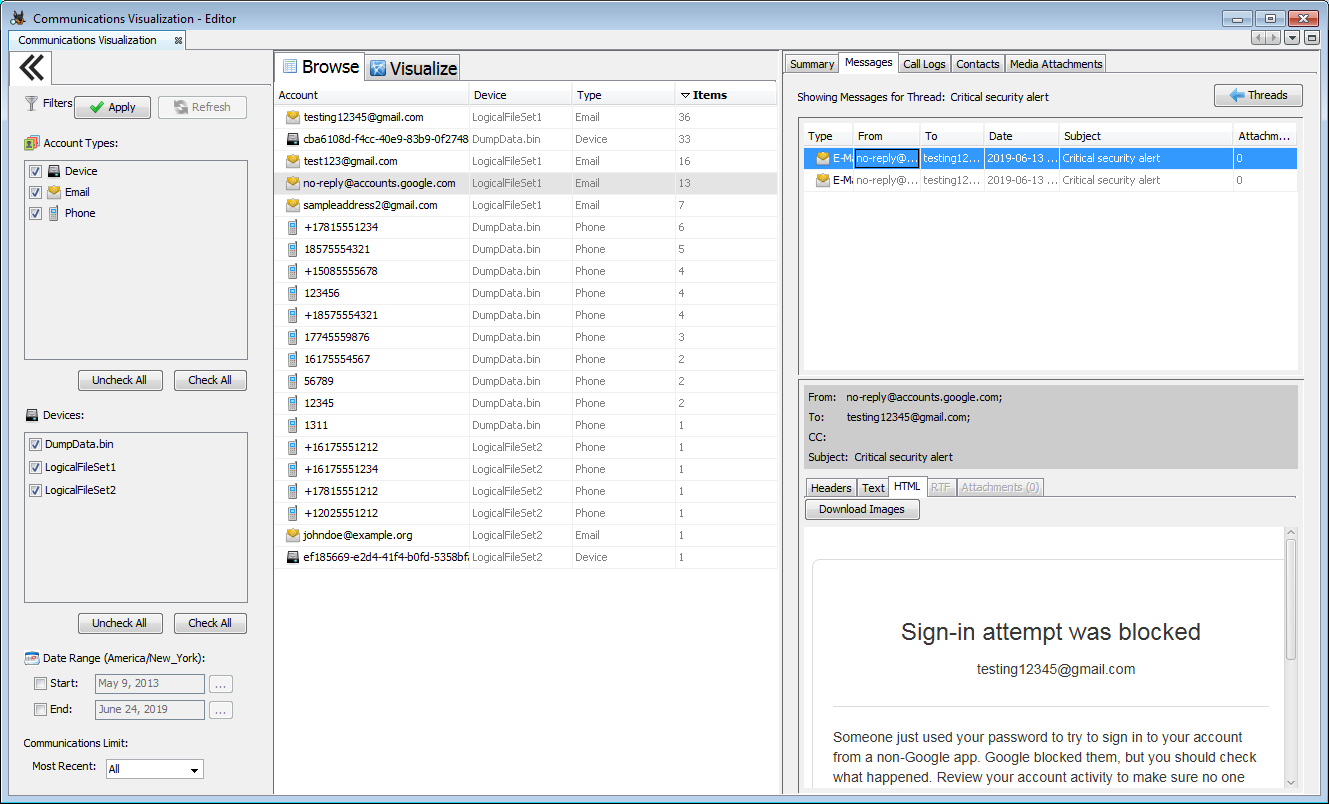
From the left hand column, you can choose which devices to display, which types of data to display, and optionally select a time range. You can also choose to limit the display to only the most recent communications. After any changes to the filters, use the Apply button to update the tables. You can hide this column by clicking the left arrow at the top of the column.
The middle column displays each account, its device and type, and the number of associated messages (emails, call logs, etc.). By default it will be sorted in descending order of frequency. The middle column and the right hand column both have a UI Quick Search feature which can be used to quickly find a visible item in their section's table.
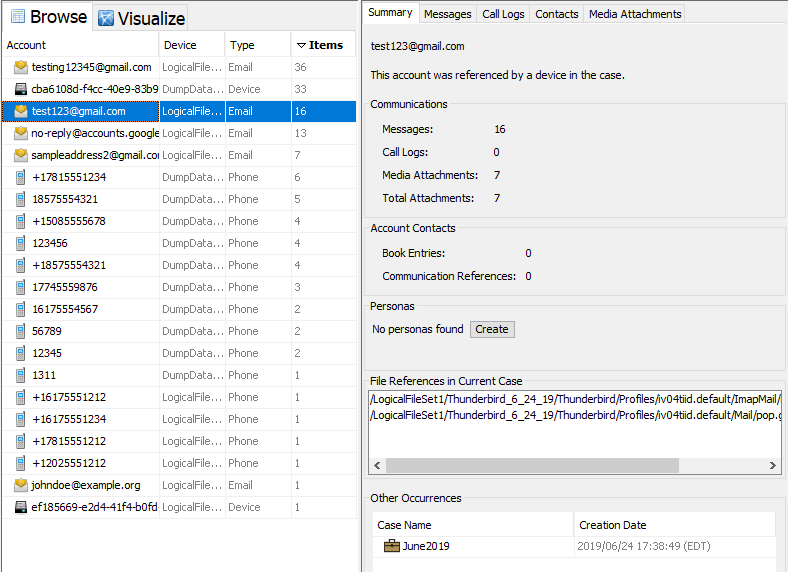
Selecting an account in the middle column will bring up the data for that account in the right hand column. There are four tabs that show information about the selected account.
-
The Summary tab displays counts of how many times the account has appeared in different data types in the top section. In the middle it displays the files this account was found in. If the Central Repository is enabled, you can see if any personas are associated with this account and whether any other cases that contained this account.
-
The Messages tab displays any messages or call logs associated with the account. The Messages will either be in a thread, or listed under a node called "Unthreaded". Clicking on the "Unthreaded" node will show all the messages that are not "Threaded".
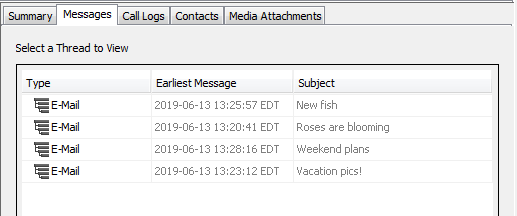
You can use the "All Messages" button at the bottom of the panel to show all messages. Clicking on a threaded message will show you all messages in that thread. You can click on an individual message to view it in the lower panel. Click the "Threads" button to return to the original screen.
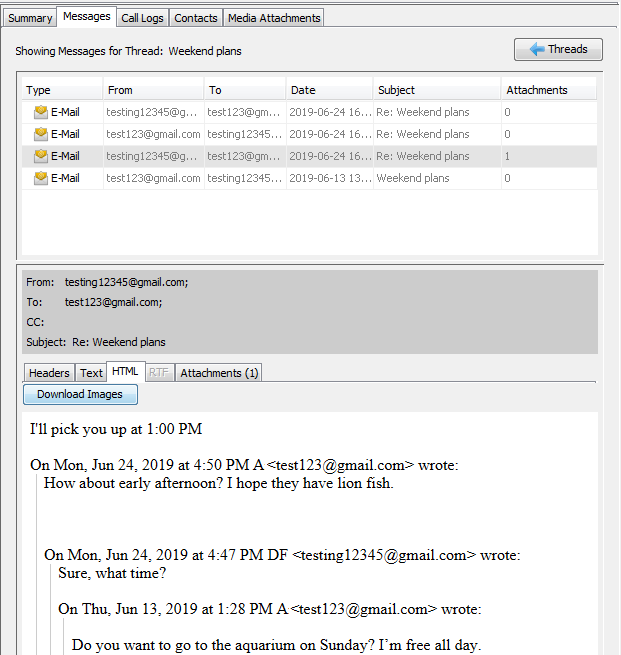
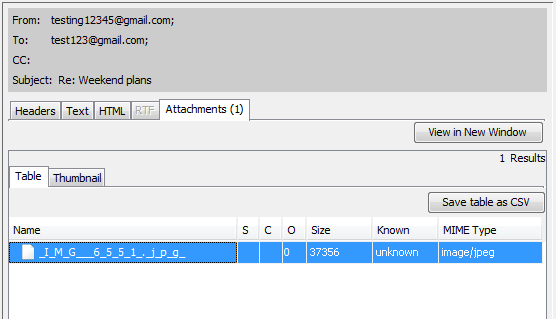
If the message has attachments, you can view them on the Attachments tab. If you select an attachment you can choose to open it in a new window, or you can look at it in the Thumbnails tab.
-
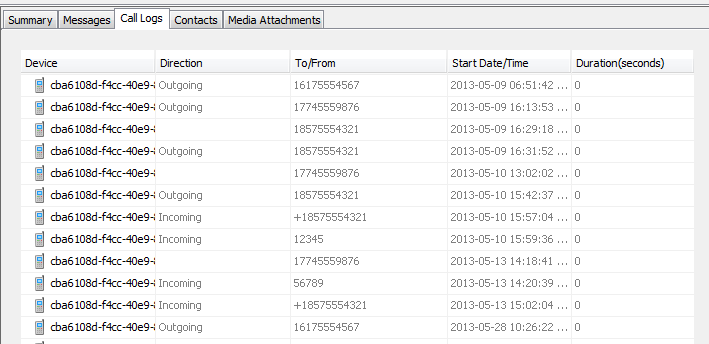
The Call Logs tab shows all call log entries involving the selected account.
-
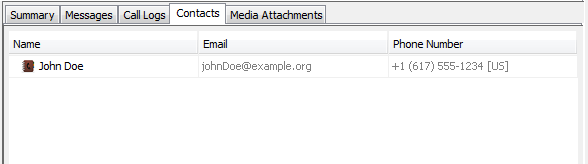
The Contacts tab shows any information on this account that was found in a contacts file.
-
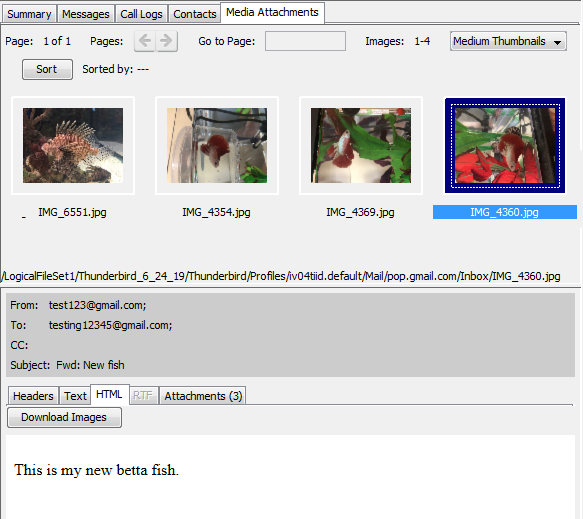
The Media Attachments tab shows thumbnails of any media files in messages for that account. If you click on one, it will show the message the media file came from.
Visualization
The Visualize tab in the middle panel will show a graph of one or more accounts selected in the Browse tab.
To start, right click the first account you want to view.

There are two options, which are equivalent when no accounts have previously been selected:
- Add Selected Account to Visualization - Adds this account and its connections to the graph
- Visualize Only Selected Account - Clears the graph and only displays the connections for this account
After selecting either option, the middle tab will switch to the Visualize view and the graph will be displayed.
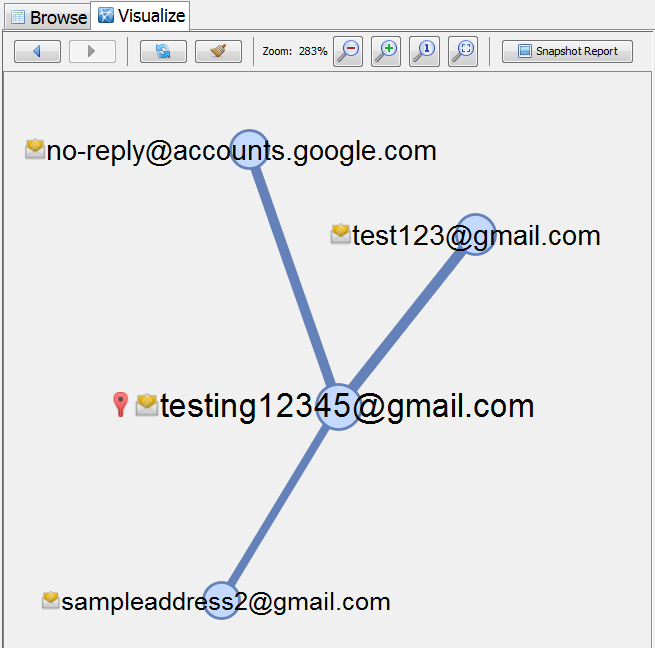
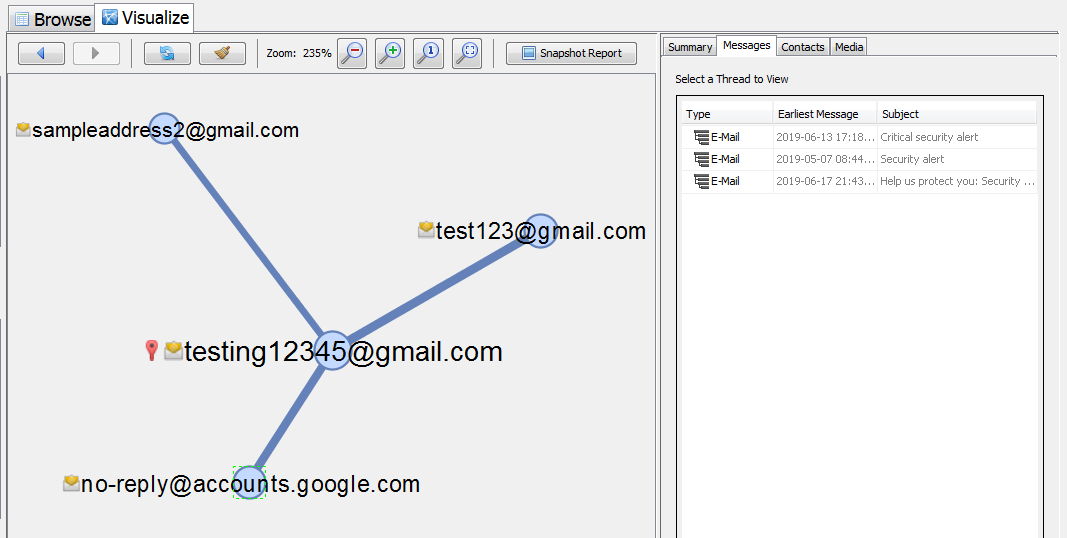
The options at the top allow you to clear the graph and resize the graph. The nodes in the graph can be dragged around and nodes and edges can be selected to display their messages or relationships in the right side tab. For example, in the image below only one node has been selected so the Messages viewer is displaying only messages involving that email address.
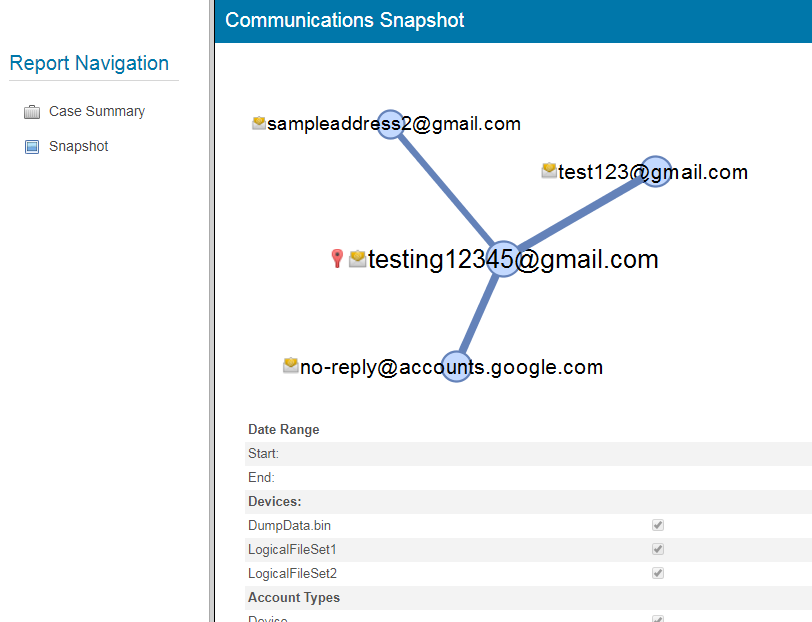
If you click the "Snapshot Report" button, you can generate a report similar to the HTML report module. Select a name for your report, which will be saved to the "Reports" folder in the current case. The Snapshot Report will contain two pages. The first will have a summary of the case, and second will contain the current graph along with your filter settings.