Timeline Analysis
Timeline analysis is useful for a variety of investigation types and is often used to answer questions about when a computer is used or what events occurred before or after a given event. Autopsy contains an advanced timeline interface that was built with funding from DHS S&T. It pulls timestamp info from the following places:
- Files
- Web artifacts
- Other Autopsy extracted data, such as EXIF and GPS
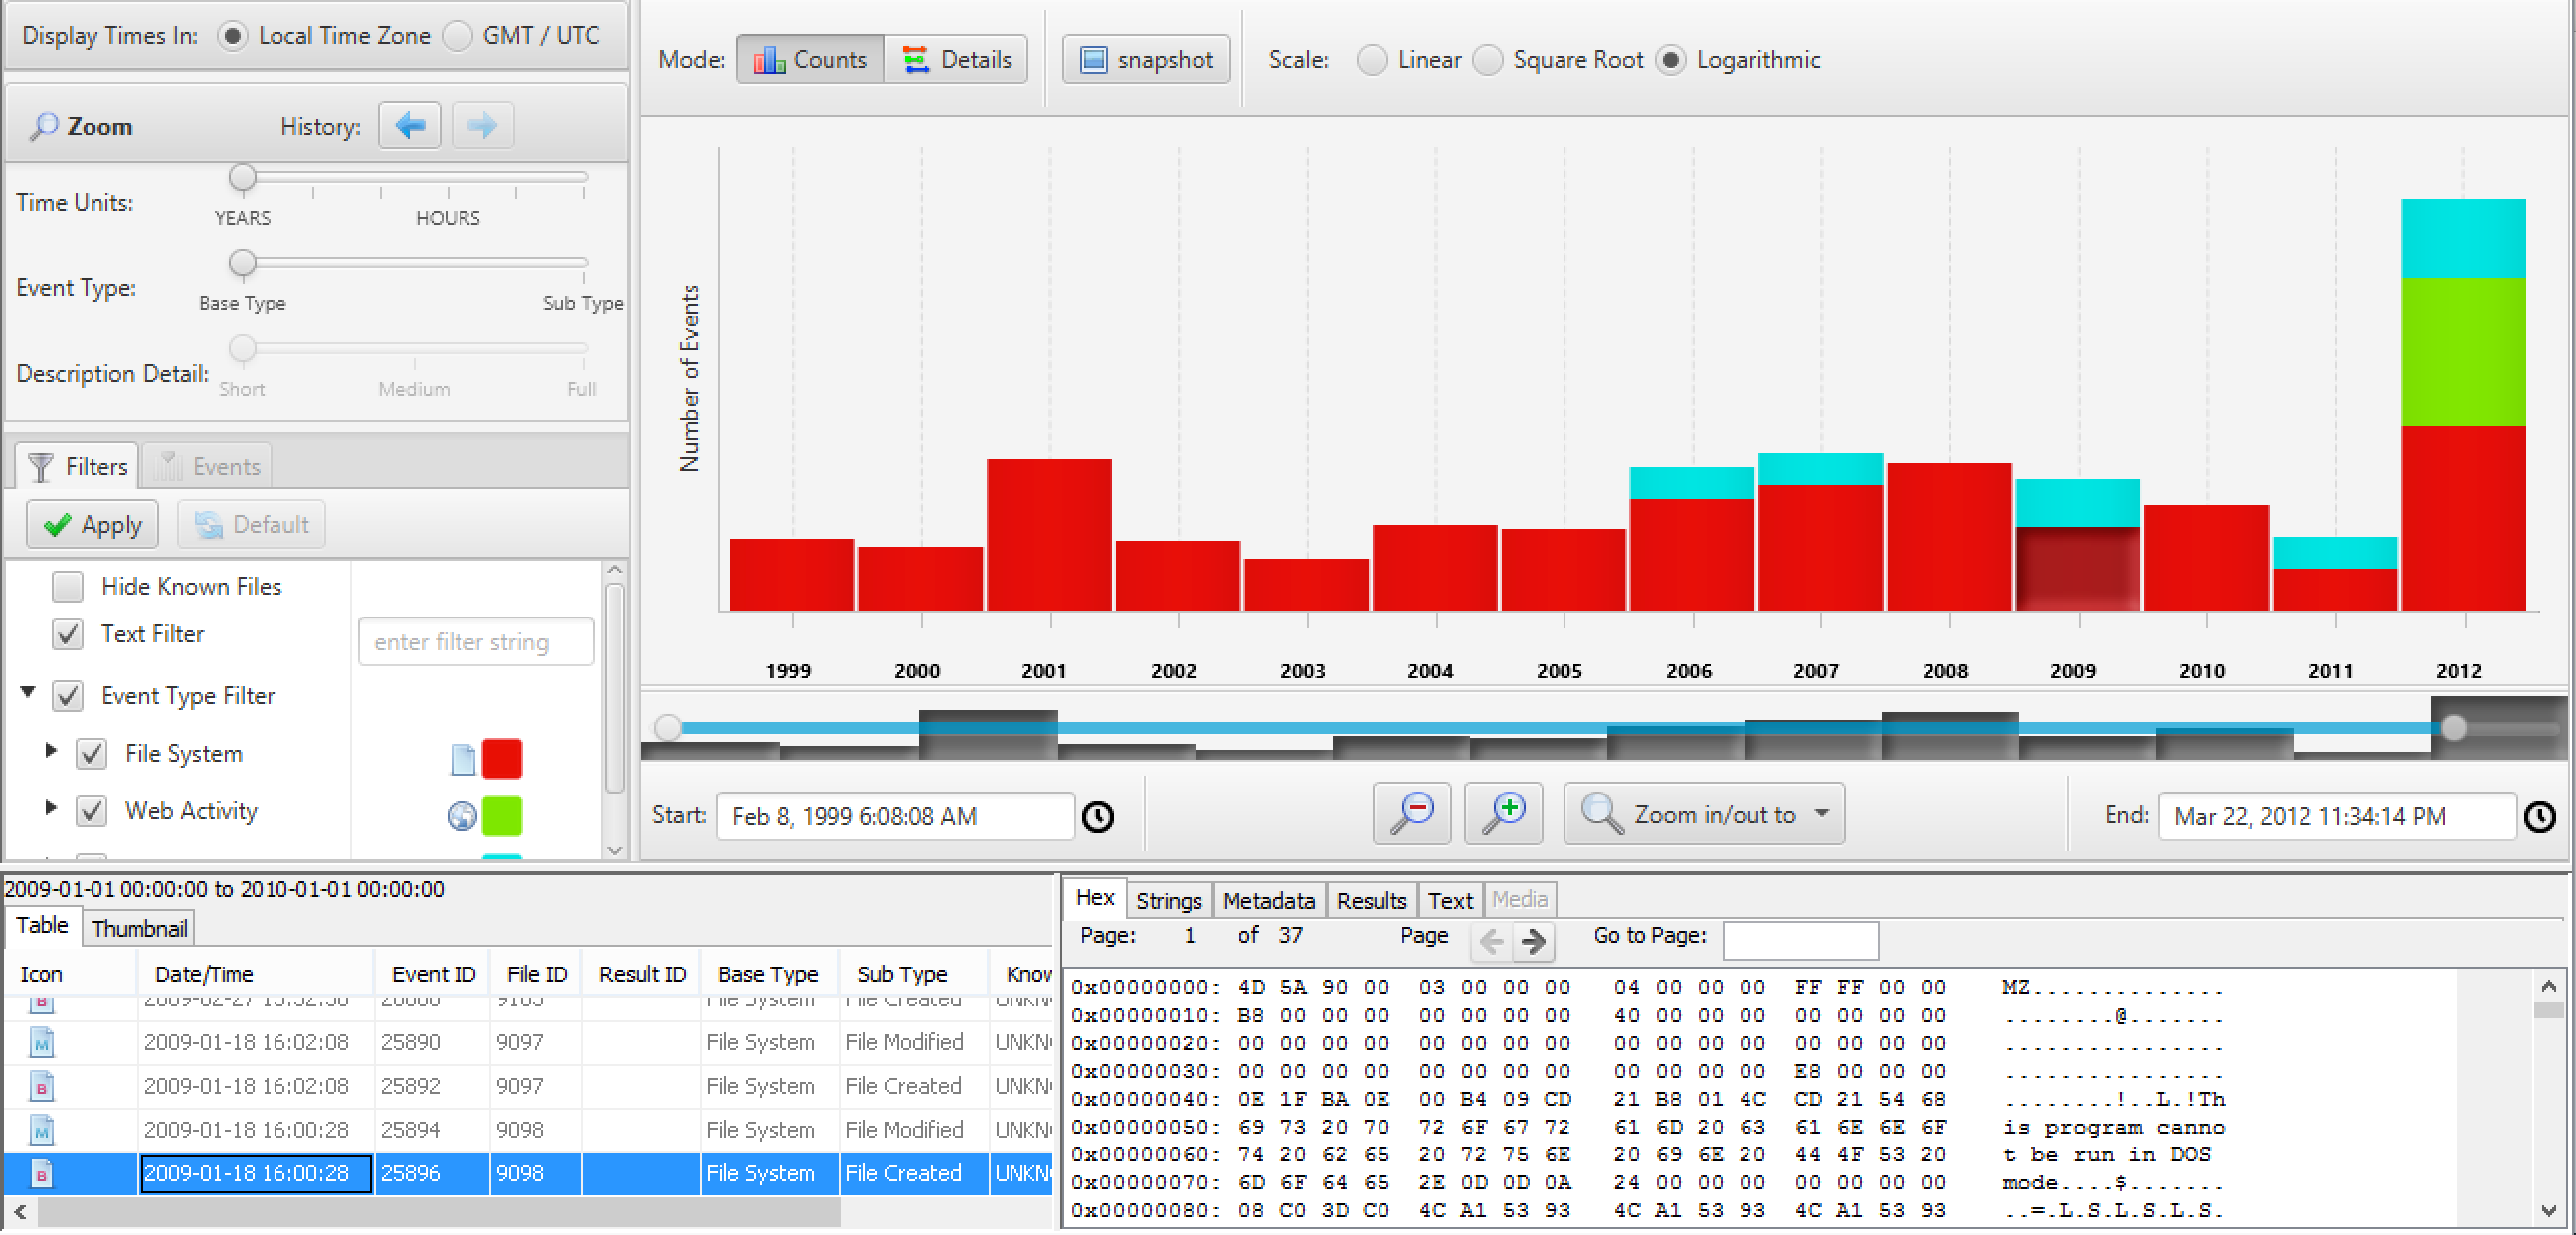
It has two display modes. The first is a bar chart that answers questions about how much data occurred in a given time frame. This interface is less about details of what occurred, but rather how much occurred.
The second interface gives you details about events. It has a unique approach of clustering similar events together to prevent data overload. Many timelines will overwhelm the user when they bring in data from many sources because it is too much to make sense of. Autopsy has a unique approach of clustering events so that, for example, all files in the same folder are shown as a single event and all URLs from the same domain are shown as a single event. If the user wants to see more details about that folder or domain, then they can zoom into it. Otherwise, it is hidden.

Regardless of the display mode, you can view file contents in a variety of viewers and have full access to the tagging abilities from Autopsy.
You can see the timeline in action from our tutorial video:
A common question is if we will integrate with Plaso. The short answer is yes. The longer answer is that we need to do some more research first because our approach of using clustering to group similar items does not currently work for any arbitrary input type that we may get from Plaso. It is currently hard coded for the input types that Autopsy produces. We will be working on a more advanced clustering approach though so that we can leverage the parsing support from Plaso.