Table of Contents
Overview
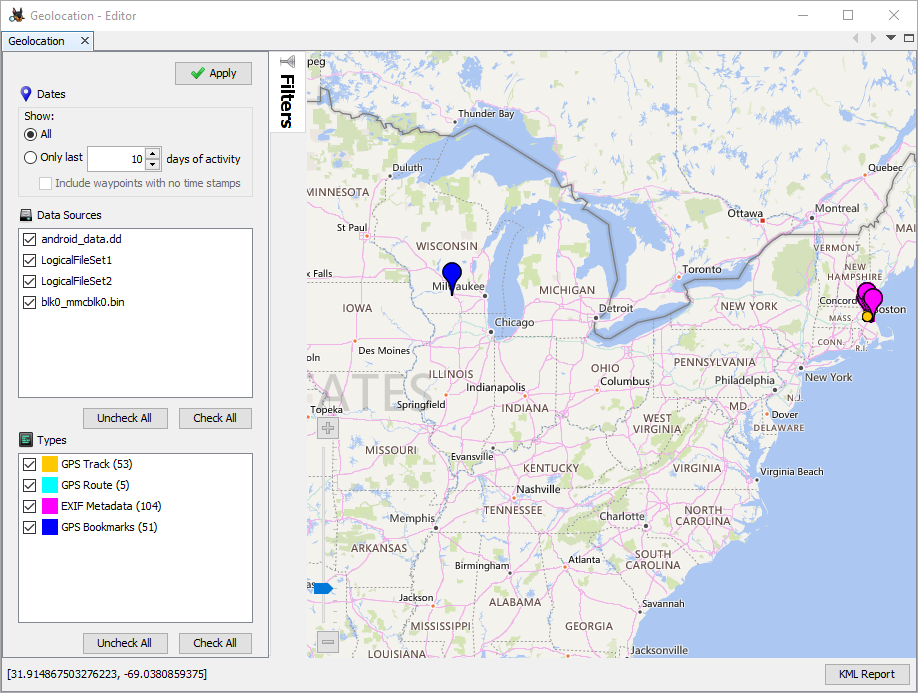
The Geolocation window shows artifacts that have longitude and latitude attributes as waypoints on a map. In the field, when access to online map tile servers may not be available, the Geolocation window provides support for offline map tile data sources.
Usage
To open the Geolocation window, click on the "Geolocation" button near the top of the main window, or go to "Tools" and then select "Geolocation".
General Usage
You can move the map by clicking and dragging, and zoom using either the mouse wheel or the slider in the bottom left of the map. If a map tile is not available, the tile will appear grey but the waypoints will still be displayed. This is more likely to happen when changing the default Map Tile Options. Different types of waypoint will be displayed in different colors. You can use the key in the lower left to easily identify the type of each waypoint. Some types will also use different icons on the map. For example, individual track points will be displayed as smaller circles. The entire track will be highlighted when selecting an individual track point.
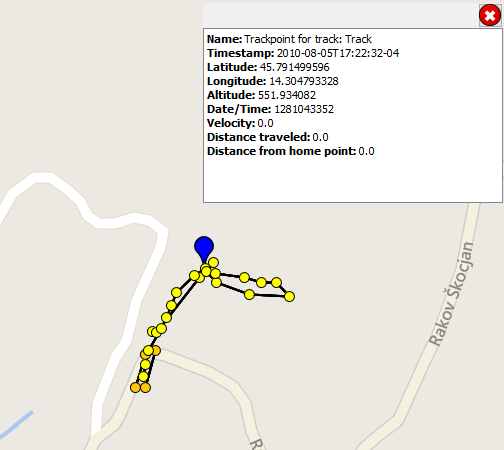
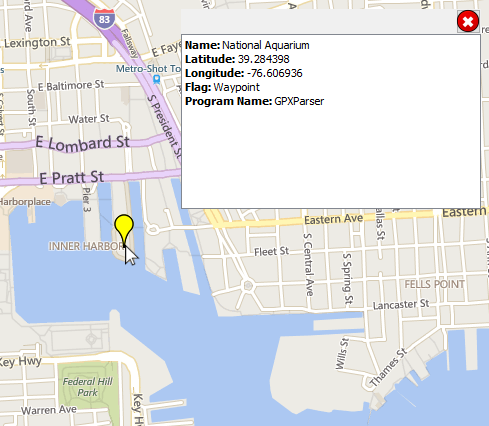
You can left click on a waypoint to highlight that waypoint and show a details pop-up in the upper right corner of the map. The details pop-up will be updated as you click on different waypoints. The data displayed will vary depending on the type of waypoint. For example, this is a GPS bookmark:
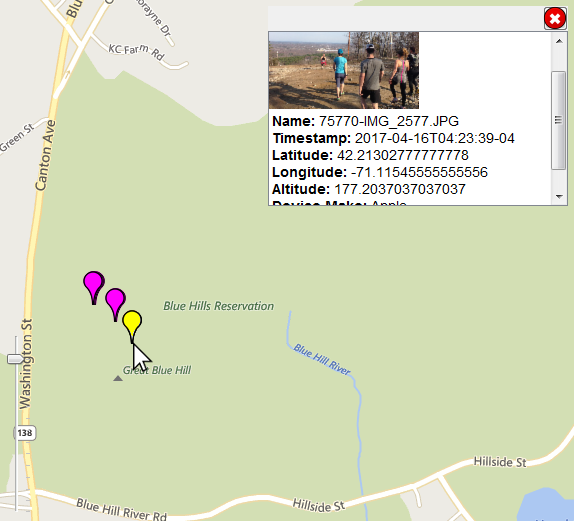
While this is an image with GPS coordinates found by the Picture Analyzer Module :
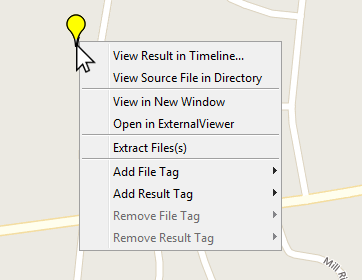
You can also right click on a waypoint to bring up a similar menu to what you'd see in the Result Viewer.
Filtering
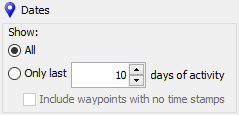
The filters are displayed on the left side of the screen. The top filter lets you filter the waypoints based on timestamp. If enabled, you will only see waypoints with a timestamp within N days of the most recent waypoint (not the current date). When using this filter, you can also choose whether you want to see waypoints with no timestamp.
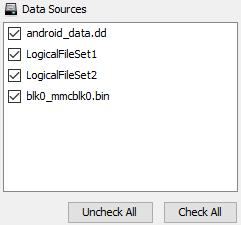
The second filter allows you to show waypoints only for the selected data sources. Note that only data sources that contain geolocation data are displayed here.
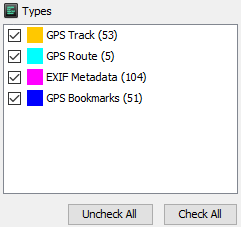
The last filter allows you to only show certain types of waypoints. The number next to the type indicates how many waypoint of that type are in your case.
Once you are done setting up your filters, click the "Apply" button at the top of the filter panel.
If desired, the filter panel can be hidden by clicking on the vertical "Filters" tab on the top right edge of the filter panel. Clicking on that tab a second time will restore the filters panel.
Generating a Report
You can generate a KML report using the "KML Report" button in the bottom right corner of the window. The report will include only the currently visible waypoints and can be found in the "Reports" folder of your case.
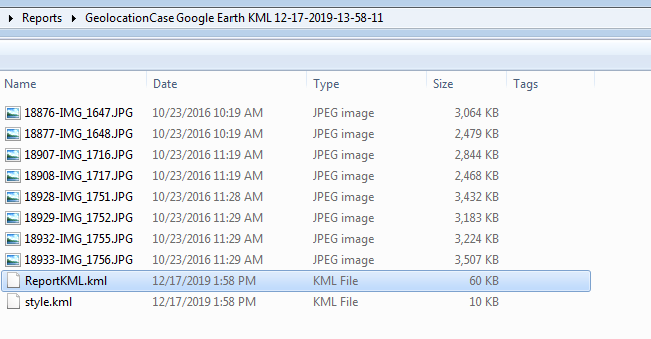
As with other report modules, the generated report will appear under "Reports" in the Tree Viewer. Note that you can also use the Google Earth KML report module to generate a report containing all geolocation data in the case.
Map Tile Options
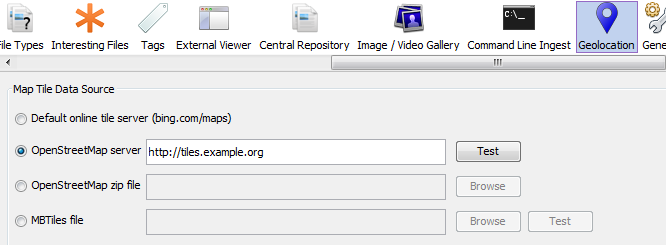
The Autopsy Geolocation window supports several map tile data source options. The map tile data source can be changed on the Geolocation panel in the Options dialog. There are four options for geolocation tile data, two of which can be used offline.
-
Default online tile server
- The default Geolocation window tile data source is the Microsoft Virtual Earth server https://www.bing.com/maps.
-
OpenStreetMap server
-
You can specify the address of an OSM tile server. A list of online tile servers can be found here: https://wiki.openstreetmap.org/wiki/Tile_servers. Tile servers may have restrictions on them that prevent Autopsy from accessing their tiles. If the tiles URL is something of the form "http://tiles.example.org/${z}/${x}/${y}.png", then you'll need to enter "http://tiles.example.org" in the options panel.
-
-
OpenStreetMap zip file
- Allows offline use of a zip file of OSM tile images
- Details on how to generate tile zip files are below.
-
MBTiles file
- Allows offline use of MBTiles file containing raster tiles.
- MBTiles raster tiles files can be downloaded from OpenMapTiles.
- OpenMapTiles provides downloads of MBTile files for areas as large as the whole planet to as small as regions of countries.
- For each of these regions there are at least four MBTiles available for download, please be sure to download one of the "Raster Tile" files, not the "Vector Tiles".
Using Maperative to Generate Tile Image Zip Files
Maperative is a tool for drawing maps, however it can also be used to create tile images. Maperative downloads and documentations can be found at http://maperitive.net/ .
By default Maperative uses an online tile server to generate the map. For offline use, users can supply an OpenStreetMap raw data extract.
Generating tile image zip files using any map data source:
- Download and run Maperative.
- Center and zoom in on an area of interest. The larger the area, the more tiles that will be generated. Tiles will be generated for the area visible in the map panel.
-
Choose whether you want to use the default zoom levels or custom ones. Zoom levels in Mapertive start at 1. As the zoom level increases, so will the quantity of tiles generated as well as the detail of each tile. Generating tiles, especially for heavily populated areas, may take time. Please be patient with either method.
-
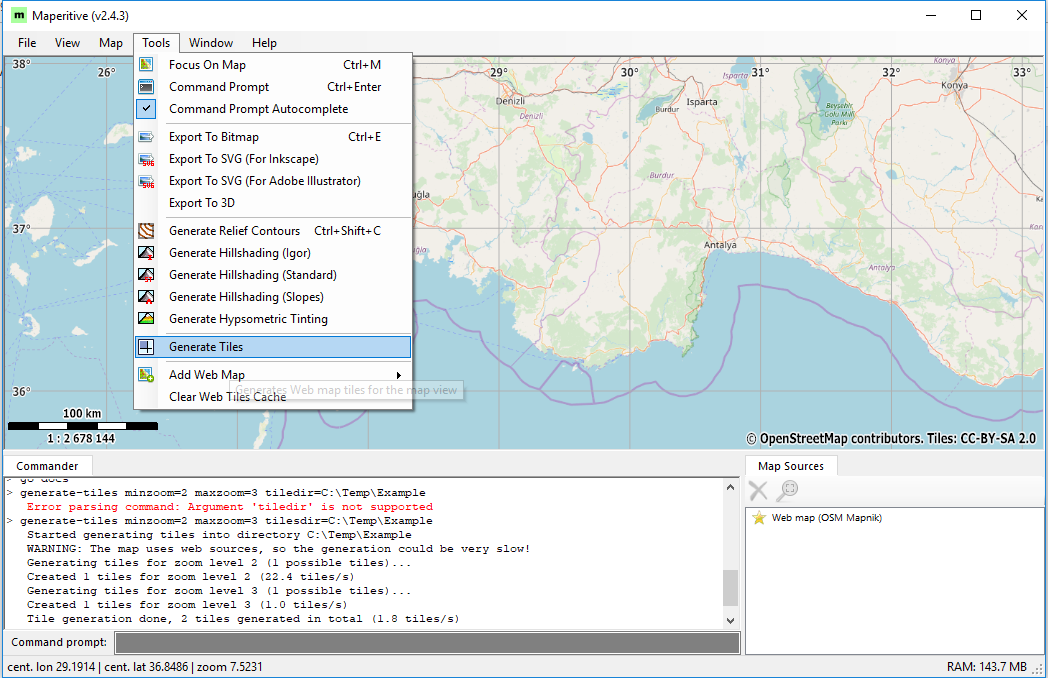
To generate tiles using the default zoom levels, select Tools->Generate Tiles
Maperative will generate tiles for zoom levels depending on the area of interest and the zoom level. For example, if you start all the way zoomed out, you will likely see levels 1 through 10 generated. If you start zoomed in, you might see levels 10 through 14.
-
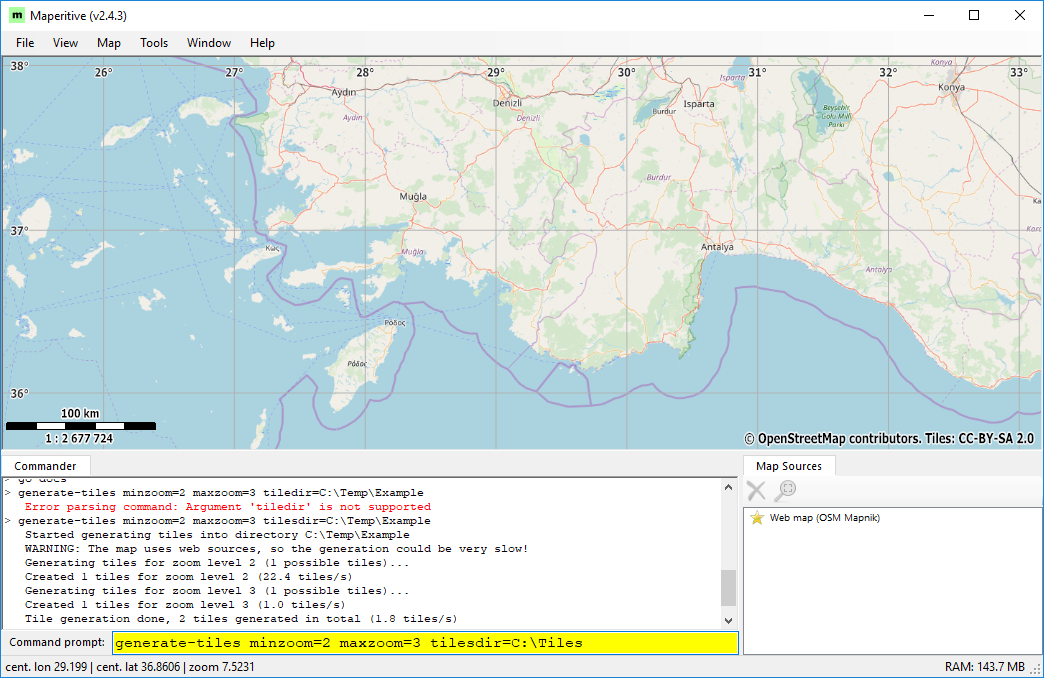
Maperative provides a command interface which allows you to generate tiles for specific zoom levels. Commands can be run in the Command prompt text field at the bottom of the Maperative window. For a full list of commands see the Maperative documentation or http://maperitive.net/docs/. The
generate-tilescommand can be used to generate tiles for the area visible in the map panel area. For full details ongenerate-tilessee the documentation included with Maperative or http://maperitive.net/docs/Commands/GenerateTiles.html. The following is a sample command to generate tiles for zoom levels 2 to 3 into the folder Tiles:generate-tiles minzoom=2 maxzoom=3 tilesdir=C:\Tiles
-
-
For use in autopsy, the generated tile images need to be in a zip file. To create a zip of tiles for use in Autopsy, zip up all of the folders in the tile file output directory. Do not include the parent directory, just the numbered folders contained within. If you use the menu bar option or did not specify a folder in your command, the generated tiles will be located in <Maperative Install Location>\Tiles.
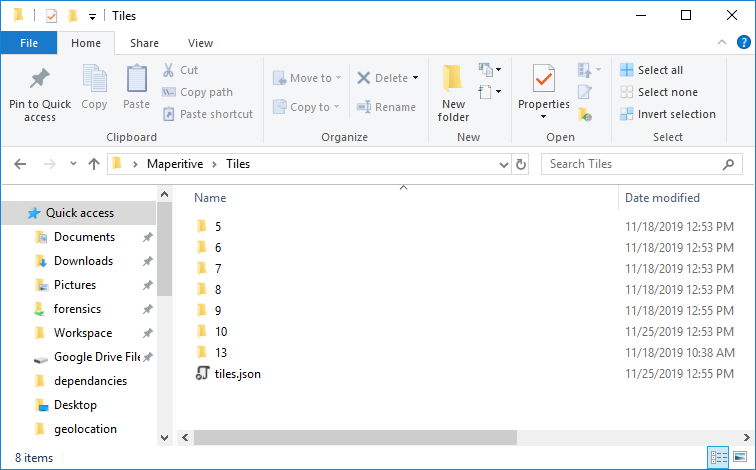
Be sure to zip only the contents of the folder, not the top level folder.
Adding a data source to Maperative
Maperative can be used to generate tiles using raw data extracts from OpenStreetMaps. Data extracts (*.osm or *.osm.pbf) files can be downloaded from various locations. See https://wiki.openstreetmap.org/wiki/Planet.osm for a list of locations. Geofabrik's free download server has open OpenStreetMap data extracts for many regions. When using OSM raw data extracts in Maperative, the recommendation is to use smaller (.osm) files.
To add a data source to Maperative:
-
Select from the menu bar File->Open Map Source...
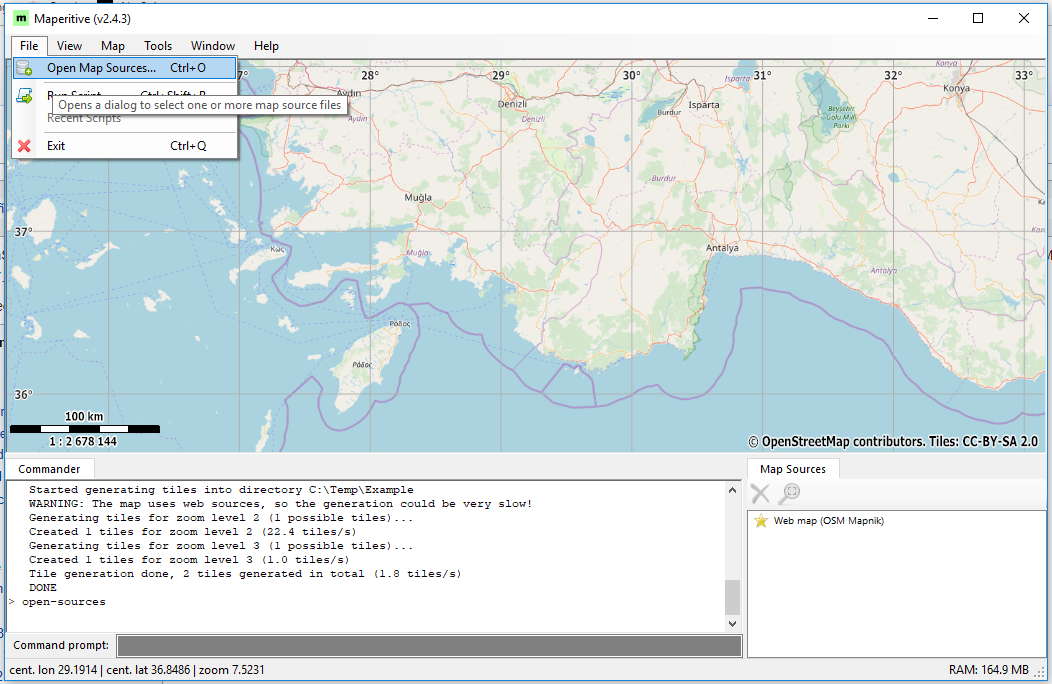
- The new data source will appear in the bottom right corner of the window in the "Map Sources" list.
- To disable a Map Source, select the Map Source from the list and click the X button.
Merging OSM raw data extracts
For ease of use, users may want to merge OSM raw data extracts. OSMConvert is a tool that can be used to merge OSM raw data extracts.
To merge two OSM raw data extracts country1.osm.pbf and country2.osm.pbf use the following commands. Note that this assumes that osmcovert and the files are in the same directory; if they are not, be sure to use full paths.
osmconvert country1.osm.pbf -o=country1.o5m
osmconvert country2.osm.pbf -o=country2.o5m
osmconvert country1.o5m country2.o5m -o=together.o5m
osmconvert together.o5m -o=together.osm.pbf